Archive
OMG! Design By Committee
In Federico Biancuzzi’s terrific “Masterminds Of Programming“, Federico interviews the three Amigo co-creators of UML. In discussing the “advancement” of the UML after the Amigos freely donated their work to the OMG for further development, Jim Rumbaugh had this to say:
The OMG (Object Management Group) is a case study in how political meddling can damage any good idea. The first version of UML was simple enough, because people didn’t have time to add a lot of clutter. Its main fault was an inconsistent viewpoint—some things were pretty high-level and others were closely aligned to particular programming languages. That’s what the second version should have cleared up. Unfortunately, a lot of people who were jealous of our initial success got involved in the second version. – Jim Rumbaugh
LOL! Following up, Jim landed a second blow:
The OMG process allowed all kinds of special interests to stuff things into UML 2.0, and since the process is mainly based on consensus, it is almost impossible to kill bad ideas. So UML 2.0 became a bloated monstrosity, with far too much dubious content, and still no consistent viewpoint and no way to define one. – Jim Rumbaugh
Double LOL!
Another UML co-creator, Grady Booch, says essentially the same thing but without specifically mentioning the OMG cabal:
UML 2.0 to some degree, and I’ll say this a little bit harshly, suffered a bit of a second system effect in that there were great opportunities and special interest groups, if you will, clamoring for certain specific features which added to the bloat of UML 2.0. – Grady Booch
Triple LOL!
Mitchi Henning, a key player during the CORBA era, rants about the OMG in this controversial “The Rise And Fall Of CORBA” article. Mitchi enraged the corbaholic community by lambasting both CORBA and the dysfunctional OMG politburo that maintains it:
Over the span of a few years, CORBA moved from being a successful middleware that was hailed as the Internet’s next-generation e-commerce infrastructure to being an obscure niche technology that is all but forgotten. This rapid decline is surprising. How can a technology that was produced by the world’s largest software consortium fall from grace so quickly? Many of the reasons are technical: poor architecture, complex APIs, and lack of essential features all contributed to CORBA’s downfall. However, such technical shortcomings are a symptom rather than a cause. Ultimately, CORBA failed because its standardization process virtually guarantees poor technical quality. Seeing that other standards consortia use a process that is very similar, this does not bode well for the viability of other technologies produced in this fashion. – Mitchi Henning
Maybe the kings and queens of the OMG should add an exclamation point to the end of their acronym: OMG!
The reason the OMG! junta interests me is because I’ve been working hands-on with RTI‘s implementation of the OMG Data Distribution Service (DDS) standard to design and build the infrastructure for a distributed sensor data processing server that will be embedded in a safety-critical supersystem. At this point in time, since DDS was co-designed, tested, and fielded by two commercial companies and it wasn’t designed from scratch by a big OMG committee, I think it’s a terrific standard. Particularly, I think RTI’s version is spectacular relative to the other two implementations that I know about. I hope the OMG! doesn’t transform DDS into an abomination………

Imperatively Dysfunctional
I’ve been programming in the C and C++ imperative languages forever. However, it seems that functional languages like Lisp, F#, Erlang, Scheme, Haskell, etc, are generating a lot of buzz these days. Curious as to what all the fuss is about, I tuned into Rebecca Parsons’ “Functional Languages 101” InfoQ video to learn more about these formerly “academic” languages.
OMG! It felt like getting a root canal without novocaine. Since I’m imperatively dysfunctional, I found her lecture to be really tough to follow. The fact that all of Rebecca’s viewgraphs were black and white text-only throwbacks to the 70’s didn’t help – not one conceptual diagram was presented.
One of Rebecca’s opening foils is shown below. As opposed to a statement, which is the fundamental unit of design in imperative languages, the pure “function” is ground zero in the functional language world. Recursion and statelessness are fundamental tenets of functional languages. Problems, even those that are naturally stateful (most real-world problems?), must be morphed into the vocabulary and semantics of functional language land.

The viewgraph below shows one of several Scheme language listings that Rebecca presented. Even after listening to her explanation of how it works, the only thing about the parentheses encoded gibberish that I grasped is that it defines the logic of three recursive functions that do something. D’oh!

In one of her last viewgraphs (see below), Ms. Parsons addressed the main reason for the rise of functional programming languages. Being a specifier/designer/developer of distributed real-time sensor systems, I’m really keen on her first bullet.

Even though watching Rebecca’s lecture didn’t enlighten me and it made my head spin, I’m going to crack open an Erlang programming book and try to learn more about the subject. Eventually, I just may “get it” and experience the “ah-ha” moment that many others seem to have experienced.

Communication Layer Performance Benchmarking
Along with two outstanding and dedicated peers, I’m currently designing and writing (in C++) a large, distributed, multi-process, multi-threaded, scalable, real-time, sensor software system. Phew, that’s a lot of “see how smart I am” techno-jargon, no?
Since the performance and reliability of the underlying Inter-Process Communication (IPC) layer is critical to meeting our customer’s end-to-end system latency and throughput requirements, we decided to measure the performance of three different IPC candidates:
- Real Time Innovations Inc.’s implementation of the Object Management Group’s Data Distribution Service (DDS) standard
- The Apache Software Foundation’s ActiveMQ implementation of the Java Messaging System (JMS) standard
- A homegrown brew built on top of the Boost Organization‘s Asio (Asychronous input output) portable C++ library.
The figure below shows the average CPU load vs throughput performance of the three distributed system messaging communication candidates. Notice that the centralized broker-based JMS approach yielded horrendous relative results.
Transmit batching, along with a whole bevy of “free” (to application layer programmers) tunable features in RTI’s DDS, consists of aggregating a bunch of application layer messages into one network packet to increase the throughput (at the expense of increased latency). Since batching isn’t available in AMQ JMS or our “homegrown” Boost.Asio comm layer candidate, only the DDS performance increase is shown on the graph.

Measurement Approach
One way to measure the CPU load imposed on a processor node by an IPC layer candidate in a data streaming, real-time, system is to quantize time into discrete slices and measure the per slice processing time that it takes to send a fixed number of messages out via the comm software stack. Since other non-deterministic OS runtime functionality shares the CPU with the application processes and the comm software stack, measuring and averaging the normalized CPU time across a large number of slices can give some quantitative feel for the load imposed on the processor.
The figure below shows the approach that was taken to measure the CPU load versus throughput performance of the three communication layer candidates. To implement this strategy, I wrote a small C++ test application that is designed to operate in a time sliced mode, where the time slice size (default = 50 msecs) is user selectable via the command line.

During runtime, the test app generates and publishes a stream of “canned” messages at a user specified rate and for a user-defined test run duration. Upon the start of each time slice, the current time is “grabbed” and stored for later use. At the end of each tight, K-message, generate-and-publish loop, the end time is retrieved from the OS and then the percent CPU load for the slice is calculated in accordance with the simple equations below. At the end of the test run, the first 1000 sample points are averaged, and the result, along with the max and min loads measured during the run are printed to the console and a date stamped log file.
 Of course, to ensure that the comm layer candidate wasn’t dropping or corrupting application messages during test runs, I wrote a subscriber app to provide a “resistor load” on the performance measuring publisher app process. By comparing the number and integrity of messages received to the number and integrity of those transmitted, the measurements were given higher credibility. The figure below shows the test fixtures that I ran the performance tests on. For the AMQ JMS candidate, a broker process was running along side of the app processes, but his single-point-of-failure component is not shown in the diagram.

Domain, Infrastructure, And Source
Via a simple SysML diagram that solely uses the “contains” relationship icon (the circled crosshairs thingy) , here’s Bulldozeroo’s latest attempt to make sense of the relationships between various levels of abstraction in the world of software as he knows it today. Notice that in Bulldozer00’s world, where the sky is purple, the architecture is at the center of the containment hierarchy.

Quantification Of The Qualitative
Because he bucked the waterfall herd and advocated “agile” software development processes before the agile movement got started, I really like Tom Gilb. Via a recent Gilb tweet, I downloaded and read the notes from his “What’s Wrong With Requirements” keynote speech at the 2nd International Workshop on Requirements Analysis. My interpretation of his major point is that the lack of quantification of software qualities (you know, the “ilities”) is the major cause of requirements screwups, cost overruns, and schedule failures.
Here are some snippets from his notes that resonated with me (and hopefully you too):
- Far too much attention is paid to what the system must do (function) and far too little attention to how well it should do it (qualities) – in spite of the fact that quality improvements tend to be the major drivers for new projects.
- There is far too little systematic work and specification about the related levels of requirements. If you look at some methods and processes, all requirements are ‘at the same level’. We need to clearly document the level and the relationships between requirements.
- The problem is not that managers and software people cannot and do not quantify. They do. It is the lack of ‘quantification of the qualitative’ that is the problem.
- Most software professionals when they say ‘quality’ are only thinking of bugs (logical defects) and little else.
- There is a persistent bad habit in requirements methods and practices. We seem to specify the ‘requirement itself’, and we are finished with that specification. I think our requirement specification job might be less than 10% done with the ‘requirement itself’.
I can really relate to items 2 and 5. Expensive and revered domain specialists often do little more than linearly list requirements in the form of text “shalls”; with little supporting background information to help builders and testers clearly understand the “what” and “why” of the requirements. My cynical take on this pervasive, dysfunctional practice is that the analysts themselves often don’t understand the requirements and hence, they pursue the path of least resistance – which is to mechanically list the requirements in disconnected and incomprehensible fragments. D’oh!

Disambiguation Text Boxes
If you believe that 2D or 3D graphical models reveal more about a system than pure 1D text models, then graphics should be the primary means of communication for complex structural and behavioral information, no? Nevertheless, sequential text annotations can be an important secondary contributor to the transmission of meaning and understanding via graphics. A skillful combination of graphics plus text is best, dontcha think?
Graphical notations, while important and useful, aren’t sufficient. They simply capture the end product of the design process as relationships between classes and objects. To reuse the design, we must also record the decisions, alternatives, and trade-offs that led to it. – The GoF
DTBs, or Disambiguation Text Boxes (a.k. a. notes, legends), can be used to help fill in some of the subtle gaps in understanding that graphics alone cannot disclose/convey to people who need to deeply understand the message/content of what you’re trying to say. DTBs can contain full sentences or just phrases and acronyms; whatever it takes to help your readers extract whatever meaning and understanding they need to do their jobs better. And you do want to help others, no?
The figures below show some examples of attempts to use DTBs to help readers understand and make meaning from graphics models. Of course, graphics and text models can’t and shouldn’t totally replace physical human-to-human interaction, but they can lessen the required frequency of face to face communication and reduce errors when face to face meetings do occur, right?


Software Debt
If it hasn’t taken place already, be prepared for the latest buzz-concept in the software development world to go viral – “Software Debt“. I think that Ward Cunningham (who I love because he invented the Wiki) is the originator of the term “technical debt“, from which “Software Debt” is, no doubt, derived.
Voila, here’s the first book that I’ve seen so far with “Software Debt” in it’s title. Expect all kinds of seminars and videos and professional “Software Bankers” (who will certainly help you keep your debt low and prevent foreclosure by your customers) to sprout up all over like fungi in a dark, stanky, and moist environment. After all, the well worn and tired “agile” buzzword needs to be replaced by something just as exciting, no?

In my twisted mind, “Software Debt” is no different, but sounds a lot kooler than the bland “Software Maintainability“. Designing, coding, and artifacting to manage “Software Debt” is no different than doing the same for “Software Maintenance“. What do you think?
“Hi, I’m a software banker and I can help you consolidate and pay off all your software debt. Trust me, I will solve all your maintenance, oops, I mean debt, problems in no time flat. Plus, my fee is reasonable.” – Bulldozer00

Feedback Insertion
Let’s say that you come up with a great product idea that is both wanted and needed by a large market (ka-ching!). Let’s also say that your product is non-trivial and it requires specialized expertise to produce it from raw inputs to its value-added end state. After mustering up enough courage and scrounging up enough money, you become an entrepreneur – whoo hoo! So, you design the system below, hire the expertise you need, and kick off the enterprise. Of course, you rightly put yourself in the controller position and serve as the system coordinator.

Uh, what’s missing from your design? Does the next picture below help? Still can figure it out?

Is feedback missing? Even though your customers need and want and buy your product, how do you know when/if your quality goes down hill and/or your customers want and need new features? Voila! You figure it out and design/install a feedback channel from your customers to you, and only you:

By responsively acting on customer inputs on your new feedback channel, you steer, guide, and direct your team back on track – until the complaints on the feedback channel start rising again. What’s wrong with your system now? Does the system augmentation below answer the question?

Because of increasing product complexity and your lack of in depth knowledge of it, (if you’re not an egomaniacal control freak,) you own up to the possibility that you could be misunderstanding and filtering out some customer feedback and you could be directing your team poorly. Accepting your humility, you set up a second feedback channel from your customers directly to your development team.
Now you’re back on track again – whoo hoo! But wait, something goes awry again and the customer complaint rate starts rising again. Since feedback solved your problems before, you set up additional feedback channels between yourself and your producer team and between your sub-teams:

Will this latest system enhancement work? Hell, I don’t know. Complexity begets complexity. Your increasingly complex system design might implode because of all the communication channels in the system and the fragmentation of contradictory messages that flow at high rates within the channels. If it doesn’t work, you could keep experimenting with changes to fine tune the system for stability and robustness.
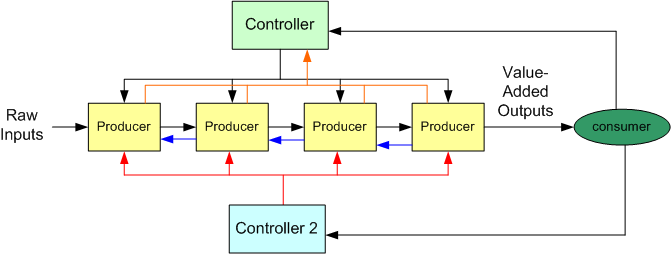
The figure below shows yet another system enhancement possibility – the addition of another controller to ensure that the production sub teams receive coherent and filtered info from your customers. It may work, but it will fail if your second controller issues guidelines, advice, commands, and orders to your production team that contradict yours.

To solve your cross-management problem, you can setup a two way channel between yourself and your second controller to resolve contradictions and ambiguities:

So, what’s the point of this long and boring, multi-picture post? Geez, I don’t know. I wrote it on the fly, in a stream of consciousness with no pre-planned point in mind.
But wait, a possible answer to the question just popped into my head out of nowhere. The point of this post is to keep adapting and trying new things when your external environment keeps changing – which it always will. One thing is for sure: don’t design your operation like the very first picture in this post – open loop. Ensure that feedback channel(s) from your customers are in place and the information that flows on it (them) is acted upon to keep your product in synch with your customers.
Sheesh, I’m finally done!
An Estimation Example
The figure below shows the derivation of an estimate of work in staff-hours to design/develop/test a Computer Software Configuration Item (CSCI) named YYYY. The estimate is based on the size of an existing CSCI named XXXX and the productivity numbers assigned to the “Real Time” category of software from the productivity chart in Steve McConnell‘s “Software Estimation: Demystifying the Black Art“.

Of course, the simple equation used to compute effort and all of the variables in it can be challenged, but would it improve the accuracy of the range of estimates?
Estimation Deflation
The best book I’ve read to date on the topic of software effort and schedule estimation is Steve McConnell‘s “Software Estimation: Demystifying the Black Art“. According to Mr. McConnell, two large influences on the amount of work required to develop a non-trivial piece of software are “size” and “kind“. Regardless of the units of measure (use cases, user stories, function points, Lines Of Code, etc), the greater the “size”, the greater the amount of work required to build the thang. Similarly, the harder “kinds” are associated with lower productivity than the simpler “kinds”.
In his book, McConnell provides the following handy, industry-data-backed, “kinds” vs “productivity” table that’s parameterized by “size” (in Lines Of Code (LOC)). Note that the “kinds” are sort of arbitrary and by no means an industry standard.

The Real-Time, 10K-100K LOC entry is circled because that’s the type and typical size of software that I specify/design/write. Note the huge 15-to-1 range of productivity for the type. Also note that the table contains large ranges of productivity for all the kind-size entries. Hint, hint: estimating is hard.
Ideally, for psuedo-accurate planning purposes, a software development org maintains its own table (see bogus example below) with real, measured numbers for the sizes of the CSCIs (Computer Software Configuration Items) that its DICs have created.
 Of course, for a variety of cultural, competence, and social reasons, a lot of orgs don’t measure or maintain a custom productivity table. Thus, estimators are forced to pull numbers out of their arses and anyone’s productivity estimate is as bad anyone else’s. Everyone who wasn’t born yesterday knows that the pressure to use ridiculously high productivity numbers in work estimates pervades the ether in most orgs. Even when some FAI bucks the trend and withstands the looks and sound bites of disdain for conjuring up a work estimate that is perceived by the management chain as “too high”, the final estimates that show up on “approved” schedules are magically deflated to what is wanted by some clueless BM, SCOL, or CGH.

Who am I?
Why am I here?
WTF?
Meh!
D'oh!
My BTC Address

