Archive
Formal Waterfall Events
If ur customer *requires* formal waterfall events like “Sys Reqs Review”, “Prelim Design Review”, “Critical Design Review”, gotta do them.
— Tony DaSilva (@Bulldozer0) March 30, 2014
The customers of all the big government-financed sensor system programs I’ve ever worked on have required the aforementioned, waterfall, dog-and-pony shows as part of their well-entrenched acquisition process. Even prior to commencing a waterfall death march, as part of the pre-win bidding process, customers also (still) require contractors to provide detailed schedule and cost commitments in their proposal submissions – right down to the CSCI level of granularity.
If you think it’s tough to get your internal executive customers to wholeheartedly embrace an “agile adoption” or “no estimates” initiative, try to wrap your mind around the cosmic difficulty of doing the same to a large, fragmented, distributed authority, external acquisition machine whose cogs are fine-tuned to: cover their ass, defend their turf, and doggedly fight to keep the extant process that justifies their worth in place. Good luck with that.

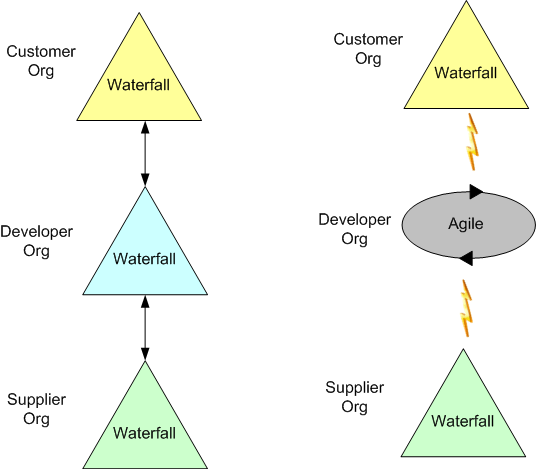
Not That Different, No?
Check out this slide I plucked from a pitch that will remain unnamed:
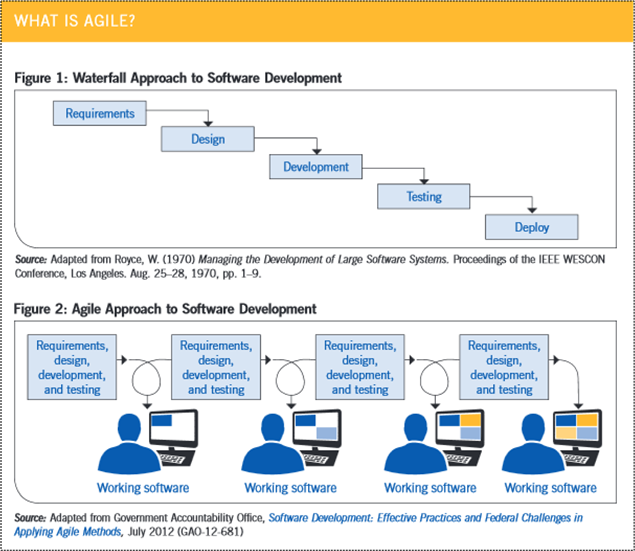
Notice the note under the waterfall diagram. Now, let’s look at the original, “unadapted” version and accompanying quote from Winston W. Royce’s classic 1970 paper:
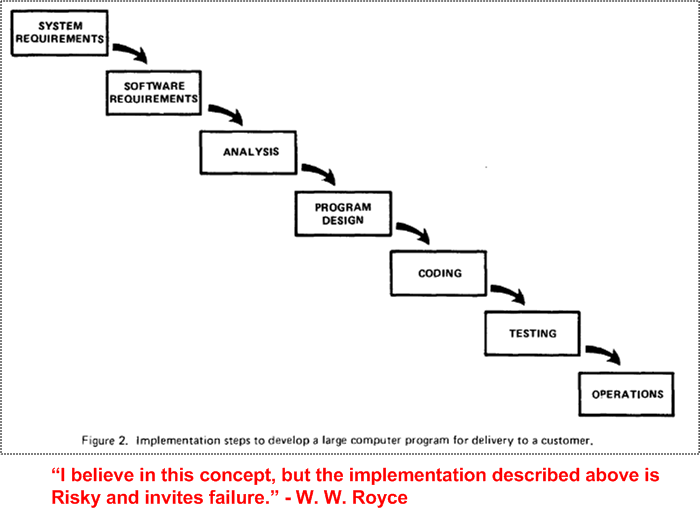
Notice that Mr. Royce clearly noted in his paper that the sequential, never-look-back, waterfall process is a stone cold loser. Next, let’s look at another diagram from Mr. Royce’s paper; one that no fragilista ever mentions or shows:
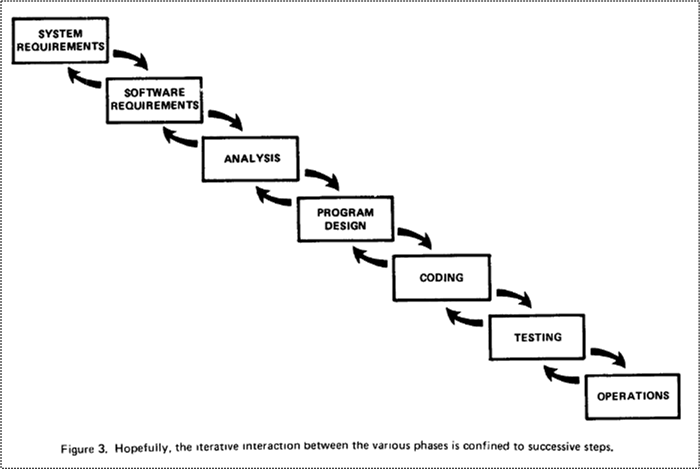
OMG! An iterative waterfall with feedback loops? WTF!
Finally, let’s look at BD00’s syntegrated version of the agile, lower half of our consultant’s diagram and the iterative waterfall diagram from Mr. Royce’s paper:
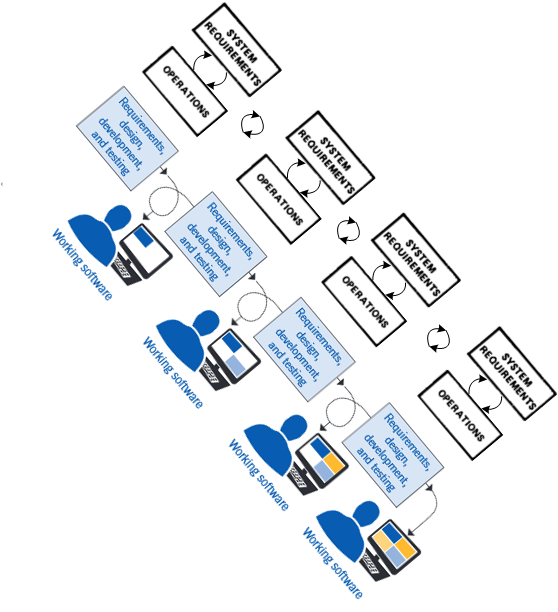
Comparing the agile and “chunked“, iterative, waterfall models shows that, taken in the right context, they’re not that different…. no?
Impedance Mismatch
The anecdotal evidence is overwhelming. Agile methods can work really well for many small teams and small projects. However, no matter what the expert, high-profile, “coaches” purport, the jury is still out regarding its scalability to large teams and large projects. In “How even agile development couldn’t keep this mega-project on track“, Nick Heath showcases the British disaster known as the £2.4bn “Universal Credit Programme“.
First, the sad fact:
…the UK government has had to write off at least £34m on the programme and delay the national launch for the project. The department in charge of the project, the Department for Work and Pensions (DWP), can’t guarantee the remainder of the £303m it has spent on the project so far will offer “good value” it said.
From the rest of Nick’s story, it becomes clear that agile methods weren’t really used to develop the software:
There was a two-year gap between the DWP starting the project design and build process, and the system going live in 2013.
The DWP experienced problems incorporating the agile approach into existing contracts, governance and assurance structures.
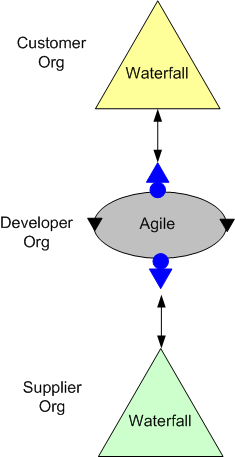
That second point is key. No matter how much a big org wants to be “agile“, it is heavily constrained by the hierarchical structures, stature-obsessed mindsets, byzantine processes, and form-filled procedures entrenched within not only itself, but also within its suppliers and customers. It’s a classic “system” problem where futzing around with one component may crash the whole system because of hardened interfaces and skin tight coupling.
As the figure below shows, attempting to “agilize” a large component within an even larger, waterfall-centric, system creates impedance mismatches at every interface. The greater the mismatch, the less productive the system becomes. Information flow and understanding between components bog down while noise and distortion overwhelm the communication channels. In the worse case, the system stops producing value-added output and it would have been better to leave the old, inefficient, waterfall-centric system intact.
The only chance an agile-wanna-be component has at decoupling itself from the external waterfall insanity is to covertly setup a two-faced, agile<->waterfall protocol converter for each of its external interfaces. Good luck pullin’ that stunt off.
One Or Many
The figure below models the increase in team stress level versus time for waterfall and time-boxed projects. As a project nears a delivery date, the stress levels increase dramatically as the team fixes turds, integrates individually developed features into the whole, and takes care of the boring but important stuff that nobody wanted to do earlier.
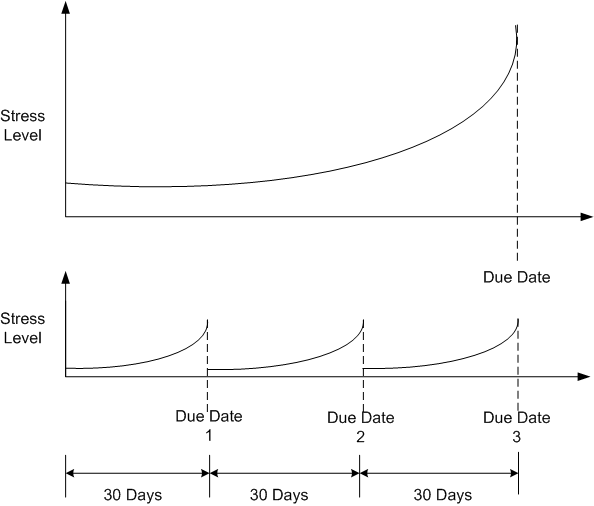
One tradeoff between the two types of projects is maximum stress level vs. number of stressful events. The maximum level of experienced stress is much higher for waterfall than any one time-boxed sprint, but it only occurs once as opposed to monthly. Pick your poison: a quick death by guillotine or a slow death by a thousand cuts.
Agilistas would have everyone believe that time-boxed projects impose a constant but very low level of healthy stress on team members while waterfall quagmires impose heart-attack levels of stress on the team. They may be right, because…..

(In case you haven’t noticed, BD00 is feeling the need to use the Einstein pic above more and more in his posts. I wonder why that is.)
Home Grounds
In Barry Boehm and Richard Turner‘s book, “Balancing Agility And Discipline“, they present the concept of the “home ground“. Agile and plan-driven (a.k.a. waterfall) software development methodologies each have their own turf where one is superior to the other for getting the job done within time, budget, and quality constraints.
As the figure below shows, the Boehm/Turner definition of “home ground” is based on 5 dimensions: personnel (experience/expertise), criticality, dynamism, size, culture.

At the origin of the 5 dimensional chart, where dynamism is high, culture is liberally open, project size is small, criticality of application is low, and the majority of the project staff is highly competent, agile approaches are more effective and efficient and efficacious. At the extremes of the 5 axes, plan-driven approaches are more effective and efficient and efficacious.
Do you think Boehm and Turner have got it right? Are there any dimensions missing from their model; like level of management humility, quality of management-knowledge worker relationships, quality of tools, quality of physical work environment?
Snap Judgments And Ineffective Decisions
In the software industry, virtually all people agree that Winston Royce‘s classic paper titled “Managing The Development Of Large Software Systems” was the first widely publicized work to describe the linear, sequential, “waterfall” method of building big systems. He didn’t coin the term “waterfall“, he called it a “grandiose process“.
Here’s one of the pics from Mr. Royce’s paper (note that he shows stage N to stage N-1 feedback loops in the diagram and note the “hopefully” word in the figure’s title):

What seems strange to me is that most professional’s that I’ve conversed with think that Mr. Royce was an advocate of this “grandiose process“. However, if you read his 11 page paper, he wasn’t:
The problem is…. The testing phase which occurs at the end of the (waterfall) development cycle is the first event for which timing, storage, input/output transfers, etc., are experienced as distinguished from analyzed. They are not precisely analyzable. They are not the solutions to the standard partial differential equations of mathematical physics for instance. – W. W. Royce
This lack of due diligence to dig deeper into Mr. Royce’s stance reminds me of bad managers who make snap judgments and ineffective decisions. They do this because, in hierarchical command & control CLORG cultures, they’re “supposed to look like” they know and understand what’s going on at all times. After all, the unquestioned assumption in hierarchies is that the best and brightest bubble up to the top. But, as Rudy sez…..
“You have to know a lot to be of help. It’s slow and tedious. You don’t have to know much to cause harm. It’s fast and instinctive.” – Rudolph Starkermann
Of course, all human beings suffer from the same “snap judgments and ineffective decisions” malady to some extent, but the guild of management-by-hierarchy, fueled by its ADHD obsession to jam fit as much attention/planning/work into as little time as possible, seems to have taken it to an extreme.
Formal Review Chain
On big, multi-year, multi-million dollar software development projects, a series of “high-ceremony” formal reviews are almost always required to be held by contract. The figure below shows the typical, sequential, waterfall review lineup for a behemoth project.

The entity below each high ceremony review milestone is “supposedly” the big star of the review. For example, at SDR, the structure and behavior of the system in terms of the set of CSCIs that comprise the “whole” are “supposedly” reviewed and approved by the attendees (most of whom are there for R&R and social schmoozing). It’s been empirically proven that the ratio of those “involved” to those “responsible” at reviews in big projects is typically 5 to 1 and the ratio of those who understand the technical content to those who don’t is 1 to 10. Hasn’t that been the case in your experience?
The figure below shows a more focused view of the growth in system artifacts as the project supposedly progresses forward in the fantasy world of behemoth waterfall disasters, uh, I mean projects. Of course, in psychedelic waterfall-land, the artifacts of any given stage are rigorously traceable back to those that were “designed” in the previous stage. Hasn’t that been the case in your experience?

In big waterfall projects that are planned and executed according to the standard waterfall framework outlined in this post, the outcome of each dog-and-pony review is always deemed a great success by both the contractee and contractor. Backs are patted, high fives are exchanged, and congratulatory e-mails are broadcast across the land. Hasn’t that been the case in your experience?
My Velocity
The figure below shows some source code level metrics that I collected on my last C++ programming project. I only collected them because the process was low ceremony, simple, and unobtrusive. I ran the source code tree through an easy to use metrics tool on a daily basis. The plots in the figure show the sequential growth in:
- The number of Source Lines Of Code (SLOC)
- The number of classes
- The number of class methods (functions)
- The number of source code files
So Whoopee. I kept track of metrics during the 60 day construction phase of this project. The question is: “How can a graph like this help me improve my personal software development process?”.

The slope of the SLOC curve, which measured my velocity throughout the duration, doesn’t tell me anything my intution can’t deduce. For the first 30 days, my velocity was relatively constant as I coded, unit tested, and integrated my way toward the finished program. Whoopee. During the last 30 days, my velocity essentially went to zero as I ran end-to-end system tests (which were designed and documented before the construction phase, BTW) and refactored my way to the end game. Whoopee. Did I need a plot to tell me this?
I’ll assert that the pattern in the plot will be unspectacularly similar for each project I undertake in the future. Depending on the nature/complexity/size of the application functionality that will need to be implemented, only the “tilt” and the time length will be different. Nevertheless, I can foresee a historical collection of these graphs being used to predict better future cost estimates, but not being used much to help me improve my personal “process”.
What’s not represented in the graph is a metric that captures the first 60 days of problem analysis and high level design effort that I did during the front end. OMG! Did I use the dreaded waterfall methodology? Shame on me.
Who am I?
Why am I here?
WTF?
Meh!
D'oh!
My BTC Address