Archive
The Boundary
Mr. Watts Humphrey‘s final book, titled “Leadership, Teamwork, and Trust: Building a Competitive Software Capability” was recently released and I’ve been reading it online. Since I’m in the front end of the book, before the TSP–PSP crap, I mean “stuff“, is placed into the limelight for sale, I’m enjoying what Watts and co-author James W. Over have written about the 21st century “management of knowledge workers problem“. Knowledge workers manipulate knowledge in the confines of their heads to create new knowledge. Physical laborers manipulate material objects to create new objects. Since, unlike physical work, knowledge work is invisible, Humphrey and Over (rightly) assert that knowledge work can’t be managed by traditional, early 20th century, management methods. In their own words:
Knowledge workers take what is known, and after modifying and extending it, they combine it with other related knowledge to actually create new knowledge. This means they are working at the boundary between what is known and what is unknown. They are extending our total storehouse of knowledge, and in doing so, they are creating economic value. – Watts Humphrey & James W. Over
But Watts and Over seem inconsistent to me (and it’s probably just me). They talk about the boundary ‘tween the known and the unknown, yet they advocate the heavyweight pre-planning of tasks down to the 10 hour level of granularity. When you know in advance that you’ll be spending a large portion of your time exploring and fumbling around in unknown territory, it’s delusional for others who don’t have to do the work themselves to expect you to chunk and pre-plan your tasks in 10 hour increments, no?

Nothing is impossible for the man who doesn’t have to do it himself. – A. H. Weiler
The Wevo Approach
The figure below shows an example of a one-size-fits-all, waterfall schedule template that’s prevalent at many old school software companies. It sure looks nice, squeaky clean, and controllable, but as everyone knows, it’s always wrong. Out of fear or apathy, almost no one speaks out against this “best practice“, but those who do are quickly slapped down by the anointed controllers and meta-controllers of the project.

A more insidious, micro-grained, version of this waterboarding fiasco is shown below. It’s a self-medicating attempt to amplify the illusion of control that’s envisioned to take place throughout the execution of the project. Since schedules are concocted before an architecture or design has been reasonably sketched out and no one can possibly know up front what all the micro tasks are, let alone how long they’ll take (unless the project is to dig ditches), it’s monstrously wrong too. But shush, don’t say a word.

Once a monstrosity like this is baked into a huge Microsoft Project file or company proprietary scheduling document, those who conjured up the camouflage auto-become loathe to modify it, even as the situation dynamically changes during the death march. Once the project starts churning, new unforeseen “popup” tasks emerge and some pre-planned micro-tasks become obsolete. These events disconnect the schedule from reality quicker than you can say “WTF?“.
Moving on to a sunnier disposition, the template below shows a more “sane“, but not infallible, method of scheduling. It’s a model of the incremental “evo” strategy that I first stumbled upon from Tom Gilb – a bazillion years before the agile movement rose to prominence. In the evo(lutionary) approach, stable working software becomes visible early with each RDCT cycle and it grows and matures as the messy (it’s always messy) project lurches forward.

The figure below shows a tweaked version of the evo model. It’s a hybrid concoction of the waterboard and evolutionary development approaches – the “wevo“. Some upfront requirements and architecture exploration/definition/specification is performed by the elected team technical leaders before staffing up for the battle against the possibility of building a BBoM. The purpose of the upfront requirements and architecture efforts are to address major cross-cutting concerns and establish contextual boundaries – before letting the dogs loose.
Of course, the wevo approach is not enough. Another necessary but insufficient requirement is that the team leaders dive into the muck with the “coders” after the cross-cutting requirements and architecture definition activities have produced a stable, understandable blueprint. No jargon spewing software “rocketects” or “pure” software project leads allowed – everyone gets dirty – and for the duration.


Are You Still Working On That?
It’s funny enough when you work for a one dimensional manager (one dimension = schedule), but it’s even funnier when another 1D manager that has nothing to do with your project stops by to chit chat and he/she inevitably asks you:
Are you still working on that?
LOL! Being 1D, and even though he/she has no idea what it takes (or should take) to finish a project, the question can be interpreted as: Since you’re not done, you’re lazy or you’re screwing up.
When the question pops up, try this Judo move:
Should I be done? How long should it have taken?
Or, you can be really nasty and retort with:
Yes I am still working on it. Sorry, but it’s not a shallow and superficial management task like signing off on a document I haven’t read or attending an agenda-less meeting that I could check off on my TODO list.
Come on, I dare you.

Estimation Deflation
The best book I’ve read to date on the topic of software effort and schedule estimation is Steve McConnell‘s “Software Estimation: Demystifying the Black Art“. According to Mr. McConnell, two large influences on the amount of work required to develop a non-trivial piece of software are “size” and “kind“. Regardless of the units of measure (use cases, user stories, function points, Lines Of Code, etc), the greater the “size”, the greater the amount of work required to build the thang. Similarly, the harder “kinds” are associated with lower productivity than the simpler “kinds”.
In his book, McConnell provides the following handy, industry-data-backed, “kinds” vs “productivity” table that’s parameterized by “size” (in Lines Of Code (LOC)). Note that the “kinds” are sort of arbitrary and by no means an industry standard.

The Real-Time, 10K-100K LOC entry is circled because that’s the type and typical size of software that I specify/design/write. Note the huge 15-to-1 range of productivity for the type. Also note that the table contains large ranges of productivity for all the kind-size entries. Hint, hint: estimating is hard.
Ideally, for psuedo-accurate planning purposes, a software development org maintains its own table (see bogus example below) with real, measured numbers for the sizes of the CSCIs (Computer Software Configuration Items) that its DICs have created.
 Of course, for a variety of cultural, competence, and social reasons, a lot of orgs don’t measure or maintain a custom productivity table. Thus, estimators are forced to pull numbers out of their arses and anyone’s productivity estimate is as bad anyone else’s. Everyone who wasn’t born yesterday knows that the pressure to use ridiculously high productivity numbers in work estimates pervades the ether in most orgs. Even when some FAI bucks the trend and withstands the looks and sound bites of disdain for conjuring up a work estimate that is perceived by the management chain as “too high”, the final estimates that show up on “approved” schedules are magically deflated to what is wanted by some clueless BM, SCOL, or CGH.

Zero Time, Zero Cost
In “The Politics Of Projects“, Robert Block states that orgs “don’t want projects, they want products“. Thus, the left side of the graph below shows the ideal project profile; zero cost and zero time. A twitch of Samantha Stevens’s nose and, voila, a marketable product appears out of thin air and the revenue stream starts flowin’ into the corpo coffers.

Based on a first order linear approximation, all earthly product development orgs get one of the performance lines on the right side of the figure. There are so many variables involved in the messy and chaotic process from viable idea to product that it’s often a crap shoot at predicting the slope and time-to-100-percent-complete end point of the performance line:
- Experience of the project team
- Cohesiveness of the project team
- Enthusiasm of the project team
- Clarity of roles and responsibilities of each team member
- Expertise in the product application domain
- Efficacy of the development tool set
- Quality of information available to, and exchanged between, project members
- Amount and frequency of meddling from external, non-project groups and individuals
- <Add your own performance influencing variable here>
To a second order approximation, the S-curve below shows real world project performance as a function of time. The slope of the performance trajectory (% progress per unit time) is not constant as the previous first order linear model implies. It starts out small during the chaotic phase, increases during the productive stage, then decreases during the closeout phase. The objective is to minimize the time spent in phases P1, P2, and P3 without sacrificing quality or burning out the project team via overwork.
 Assume (and it’s a bad assumption) that there’s an objective and accurate way of measuring “% complete” at any given time for a project. Now, assume that you’ve diligently tracked and accumulated a set of performance curves for a variety of large and small projects and a variety of teams over the years. Armed with this data and given a new project with a specific assigned team, do you think you could accurately estimate the time-to-completion of the new project? Why or why not?
Wishful And Realistic
As software development orgs grow, they necessarily take on larger and larger projects to fill the revenue coffers required to sustain the growth. Naturally, before embarking on a new project, somebody’s gotta estimate how much time it will take and how many people will be needed to get it done in that guesstimated time.
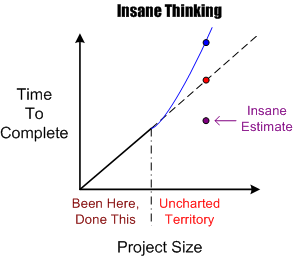
The figure below shows an example of the dumbass linear projection technique of guesstimation. Given a set of past performance time-size data points, a wishful estimate for a new and bigger project is linearly extrapolated forward via a neat and tidy, mechanistic, textbook approach. Of course, BMs, DICs, and customers all know from bitter personal experience that this method is bogus. Everyone knows that software projects don’t scale linearly, but (naturally) no one speaks up out of fear of gettin’ their psychological ass kicked by the pope du jour. Everyone wants to be perceived as a “team” player, so each individual keeps their trap shut to avoid the ostracism, isolation, and pariah-dom that comes with attempting to break from clanthink unanimity. Plus, even though everyone knows that the wishful estimate is an hallucination, no one has a clue of what it will really take to get the job done. Hell, no one even knows how to define and articulate what done means. D’oh! (Notice the little purple point in the lower right portion of the graph. I won’t even explain its presence because you can easily figure out why it’s there.)
 OK, you say, so what works better Mr. Smarty-Pants? Since no one knows with any degree of certainty what it will take to “just get it done” (<- tough management speak – lol!) nothing really works in the absolute sense, but there are some techniques that work better than the standard wishful/insane projection technique. But of course, deviation from the norm is unacceptable, so you may as well stop reading here and go back about your b’ness.
One such better, but forbidden, way to estimate how much time is needed to complete a large hairball software development project is shown below. A more realistic estimate can be obtained by assuming an exponential growth in complexity and associated time-to-complete with increasing project size. The trick is in conjuring up values for the constant K and exponent M. Hell, it requires trickery to even come up with an accurate estimate of the size of the project; be it function points, lines of code, number of requirements or any other academically derived metric.

An even more effective way of estimating a more accurate TTC is to leverage the dynamic learning (gasp!) that takes place the minute the project execution clock starts tickin’. Learning? Leverage learning? No mechanistic equations based on unquantifiable variables? WTF is he talkin’ bout? He’s kiddin’ right?

Push Back
Besides being volatile, unpredictable, and passionate, I “push back” against ridiculous schedules. While most fellow DICs passively accept hand-me-down schedules like good little children and then miss them by a mile, I rage against them and miss them by a mile. Duh, stupid me.
How about you? What do you do, and why?

A Contrast In Usability
I own two wildly different books dedicated to the topic of software estimation:
- Steve McConnell’s pragmatic and down to earth “Software Estimation: Demystifying the Black Art“
- Richard Stutzke’s massive, academic tome: “Estimating Software-Intensive Systems: Projects, Products, and Processes“
I have several of McConnell’s books and I think that he is a brilliant, understandable teacher of all things software. Steve’s concern for, and empathy towards, the layman software engineer shows. Stutzke, on the other hand, is an impressive equation-wielder and master complexity amplifier who seems more concerned with showing off his IQ to fellow elites than transmitting usable information to the dudes in the trenches. It could take more time to apply Stutzke’s work for estimating the size and effort to develop a large software-intensive system than to build the actual system itself.
Since McConnell’s book is half the price of Stutzke’s, buy two of them – one for yourself and one for your manager. On the other hand, give the second one to a colleague since most managers, BM or otherwise, don’t read technical stuff. They also don’t believe in estimation. They delusionally believe in certainty so they can populate their massive and useless Microsoft project files with exact numbers and never revise them until the fit hits the shan and it’s time to apportion blame to the DICforce.

Percent Complete
In order to communicate progress to someone who requires a quantitative number attached to it, some sort of consistent metric of accomplishment is needed. The table below lists some of the commonly used size metrics in the software development world.

All of these metrics suffer to some extent from a “consistency” problem. The problem (as exemplified in the figure below) is that, unlike a standard metric such as the “meter”, the size and meaning of each unit is different from unit to unit within an application, and across applications. Out of all the metrics in the list, the definition of what comprises a “Function Point” unit seems to be the most rigorous, but it still suffers from a second, “translation” problem. The translation problem manifests when an analyst attempts to convert messy and ambiguous verbal/written user needs into neat and tidy requirement metrics using one of the units in the list.

Nevertheless, numerically-trained MBA and PMI certified managers and their higher up executive bosses still obsessively cling to progress reports based on these illusory metrics. These STSJs (Status Takers and Schedule Jockeys) love to waste corpo time passing around status reports built on quicksand like the “percent done” example below.

The problems with using graphs like this to “direct” a project are legion. First, it is assumed that the TNFP is known with high accuracy at t=0 and, more erroneously, that its value stays constant throughout the duration. A second problem with this “best practice” is that lots, if not all, non-trivial software development projects do not progress linearly with the passage of time. The green trace in the graph is an example of a non-linearly progressing project.
Since most managers are sequential, mechanistic, left-brain-trained thinkers, they falsely conclude that all projects progress linearly. These bozelteens also operate under the meta-assumption that no initial assumptions are violated during project execution (regardless of what items they initially deposited in their “risk register” at t=0). They mistakenly arrive at conclusions like: ” if it took you two weeks to get to 50% done, you will be expected to be done in two more weeks”. Bummer.
Even after trashing the “percent complete” earned-value-management method in the previous paragraphs, I think there is a chance to acquire a long term benefit by tracking progress this way. The benefit can accrue IF AND ONLY IF the method is not taken too seriously and it’s not used to impose undue stress upon the software creators and builders who are trying their best to balance time-cost and quality. Performing the “percent complete” method over a bunch of projects and averaging the results can yield decent, but never 100% accurate, metrics that can be used to more effectively estimate future project performance. What do you think?
A Professional Failure
I’m a professional failure. Why? Because I’m pretty sure that I’ve never satisfied any unreasonable schedule that I was ever “given” to meet. Since almost all schedules are unreasonable, then, by definition, I’m a professional failure. Hell, it didn’t even matter if I was the one who created the unreasonable schedule in the first place, I’ve failed. Bummer.

Looking back, I think that I’ve figured out why I underperformed (<– that’s management-speak for “failed”). It’s simply that the problem solving projects that I’ve worked on have been grossly underestimated. Why is that? Because they all required learning something new and acquiring new knowledge in the problem area of pecuniary interest.
So, how can you know if a given schedule is unreasonable, and does it matter if you conclude that meeting the schedule is a lost cause? You most likely can’t, and no, it doesn’t matter. Assume that, based on personal experience and a deep “knowing” of what’s involved in a project, you actually can determine that the schedule is a laughable, but innocent, lie. There’s nothing you can do about it. If you speak up, at best, you’ll be ignored. At worst, you’ll receive multiple peek-a-boo visits from one or more STSJs (Status Taker and Schedule Jockey) who don’t have to do any of the project work themselves.
How about you, have you been a perpetual failure like me? Of course not. Your resume says here that you have been 100% successful on every project you’ve worked on; and that implies that you’ve met every schedule. But wait, every other resume in my stack says the same thing. Damn! How am I gonna decide among all of these perfect people who gets the job?
Who am I?
Why am I here?
WTF?
Meh!
D'oh!
My BTC Address

