Communication Layer Performance Benchmarking
Along with two outstanding and dedicated peers, I’m currently designing and writing (in C++) a large, distributed, multi-process, multi-threaded, scalable, real-time, sensor software system. Phew, that’s a lot of “see how smart I am” techno-jargon, no?
Since the performance and reliability of the underlying Inter-Process Communication (IPC) layer is critical to meeting our customer’s end-to-end system latency and throughput requirements, we decided to measure the performance of three different IPC candidates:
- Real Time Innovations Inc.’s implementation of the Object Management Group’s Data Distribution Service (DDS) standard
- The Apache Software Foundation’s ActiveMQ implementation of the Java Messaging System (JMS) standard
- A homegrown brew built on top of the Boost Organization‘s Asio (Asychronous input output) portable C++ library.
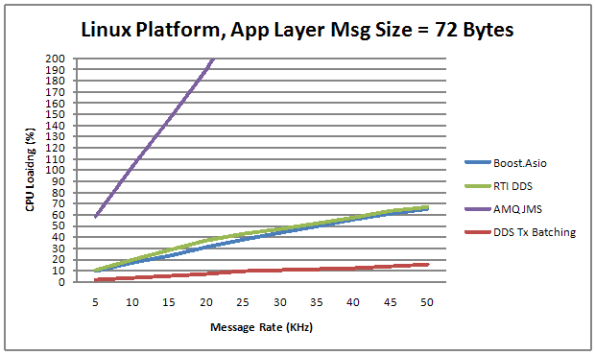
The figure below shows the average CPU load vs throughput performance of the three distributed system messaging communication candidates. Notice that the centralized broker-based JMS approach yielded horrendous relative results.
Transmit batching, along with a whole bevy of “free” (to application layer programmers) tunable features in RTI’s DDS, consists of aggregating a bunch of application layer messages into one network packet to increase the throughput (at the expense of increased latency). Since batching isn’t available in AMQ JMS or our “homegrown” Boost.Asio comm layer candidate, only the DDS performance increase is shown on the graph.
Measurement Approach
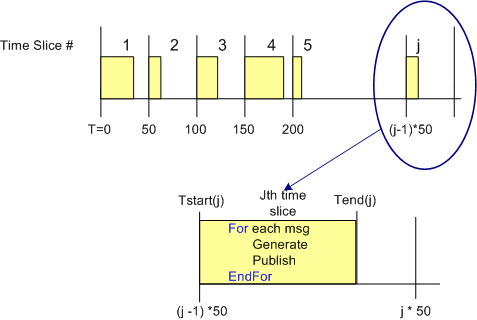
One way to measure the CPU load imposed on a processor node by an IPC layer candidate in a data streaming, real-time, system is to quantize time into discrete slices and measure the per slice processing time that it takes to send a fixed number of messages out via the comm software stack. Since other non-deterministic OS runtime functionality shares the CPU with the application processes and the comm software stack, measuring and averaging the normalized CPU time across a large number of slices can give some quantitative feel for the load imposed on the processor.
The figure below shows the approach that was taken to measure the CPU load versus throughput performance of the three communication layer candidates. To implement this strategy, I wrote a small C++ test application that is designed to operate in a time sliced mode, where the time slice size (default = 50 msecs) is user selectable via the command line.
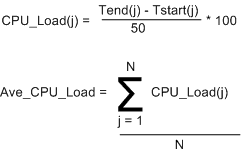
During runtime, the test app generates and publishes a stream of “canned” messages at a user specified rate and for a user-defined test run duration. Upon the start of each time slice, the current time is “grabbed” and stored for later use. At the end of each tight, K-message, generate-and-publish loop, the end time is retrieved from the OS and then the percent CPU load for the slice is calculated in accordance with the simple equations below. At the end of the test run, the first 1000 sample points are averaged, and the result, along with the max and min loads measured during the run are printed to the console and a date stamped log file.
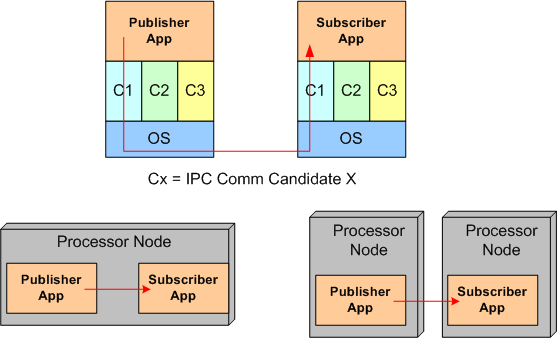
 Of course, to ensure that the comm layer candidate wasn’t dropping or corrupting application messages during test runs, I wrote a subscriber app to provide a “resistor load” on the performance measuring publisher app process. By comparing the number and integrity of messages received to the number and integrity of those transmitted, the measurements were given higher credibility. The figure below shows the test fixtures that I ran the performance tests on. For the AMQ JMS candidate, a broker process was running along side of the app processes, but his single-point-of-failure component is not shown in the diagram.


So did you use asio, Tony? I have a similar product to work on, and am starting to use ASIO. Also NNG possibly.
I haven’t seen other posts from you in a while, how are you doing?